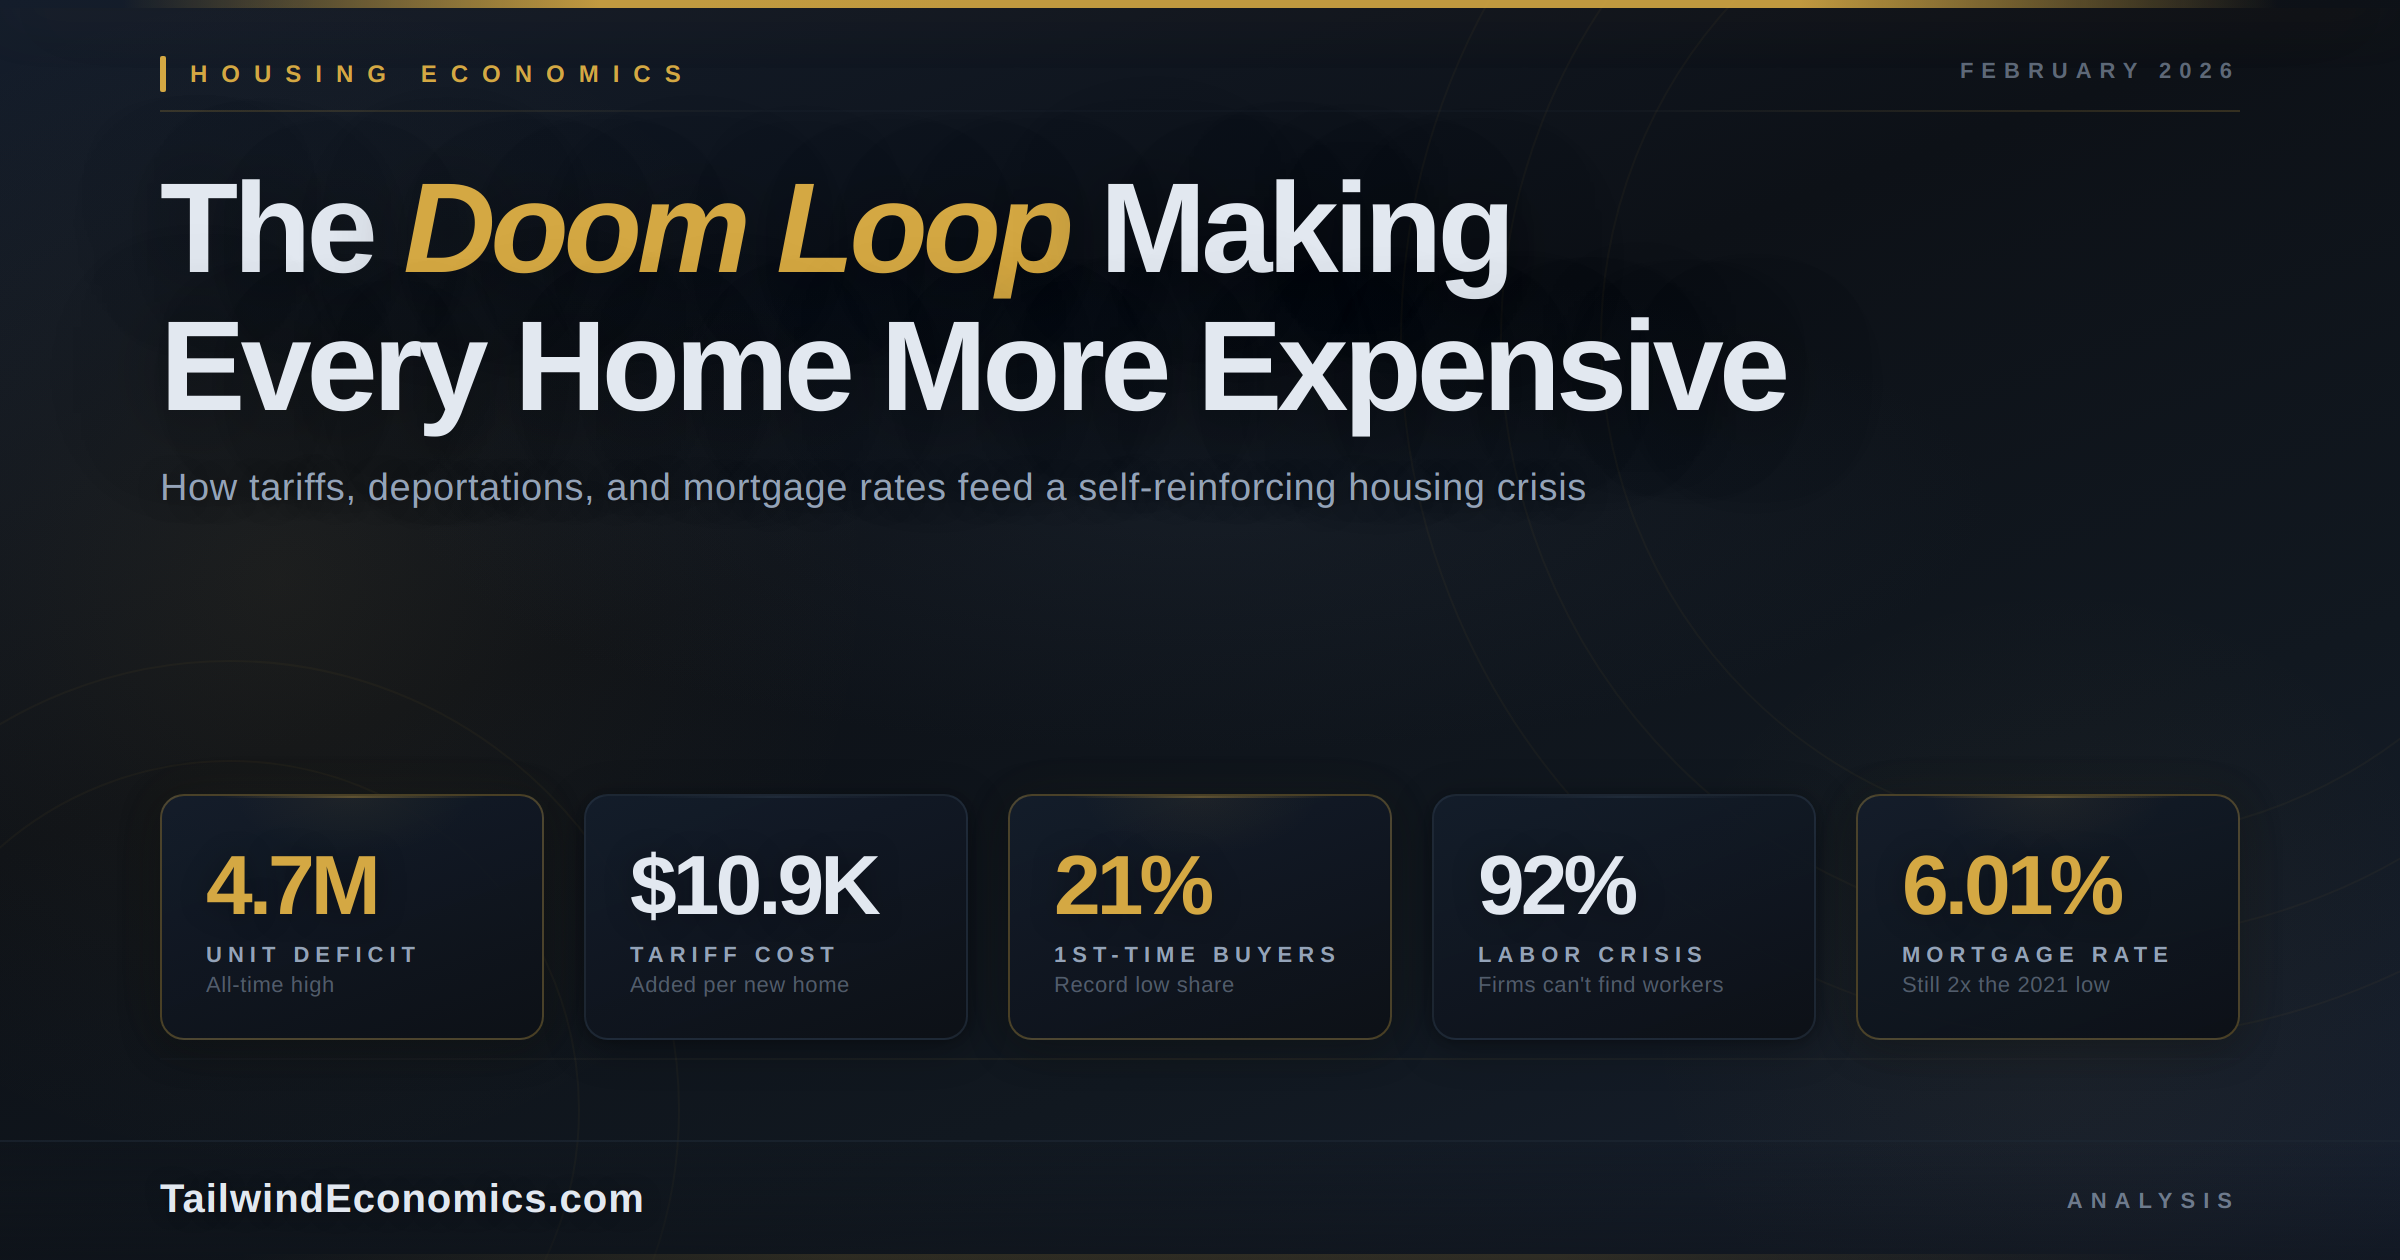
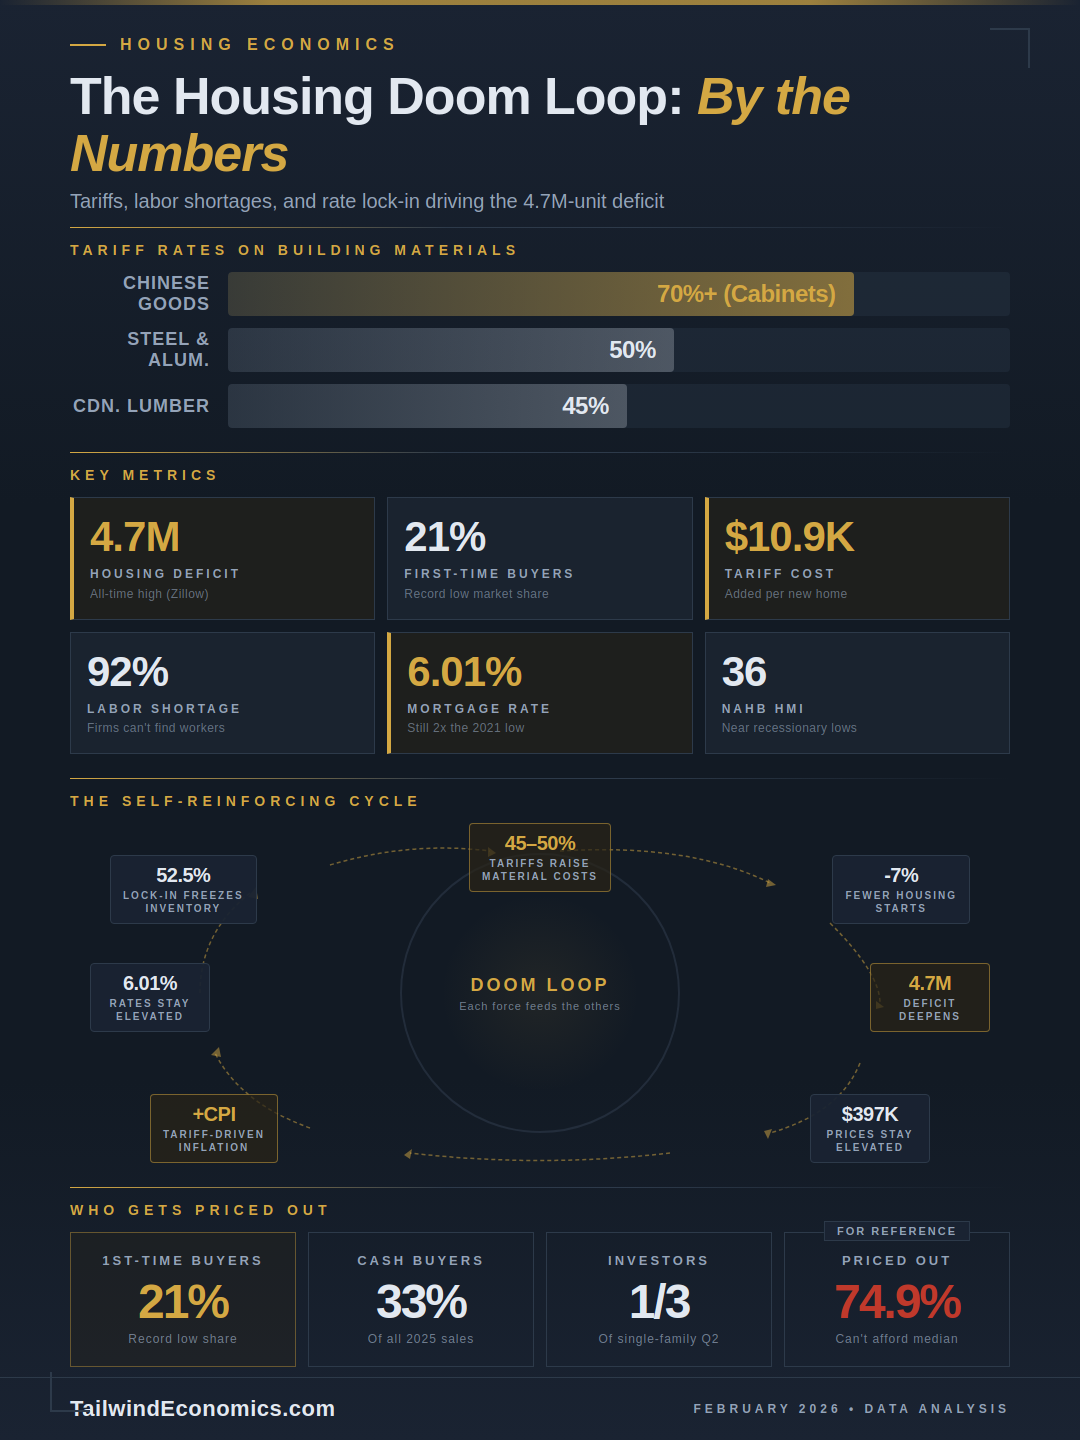
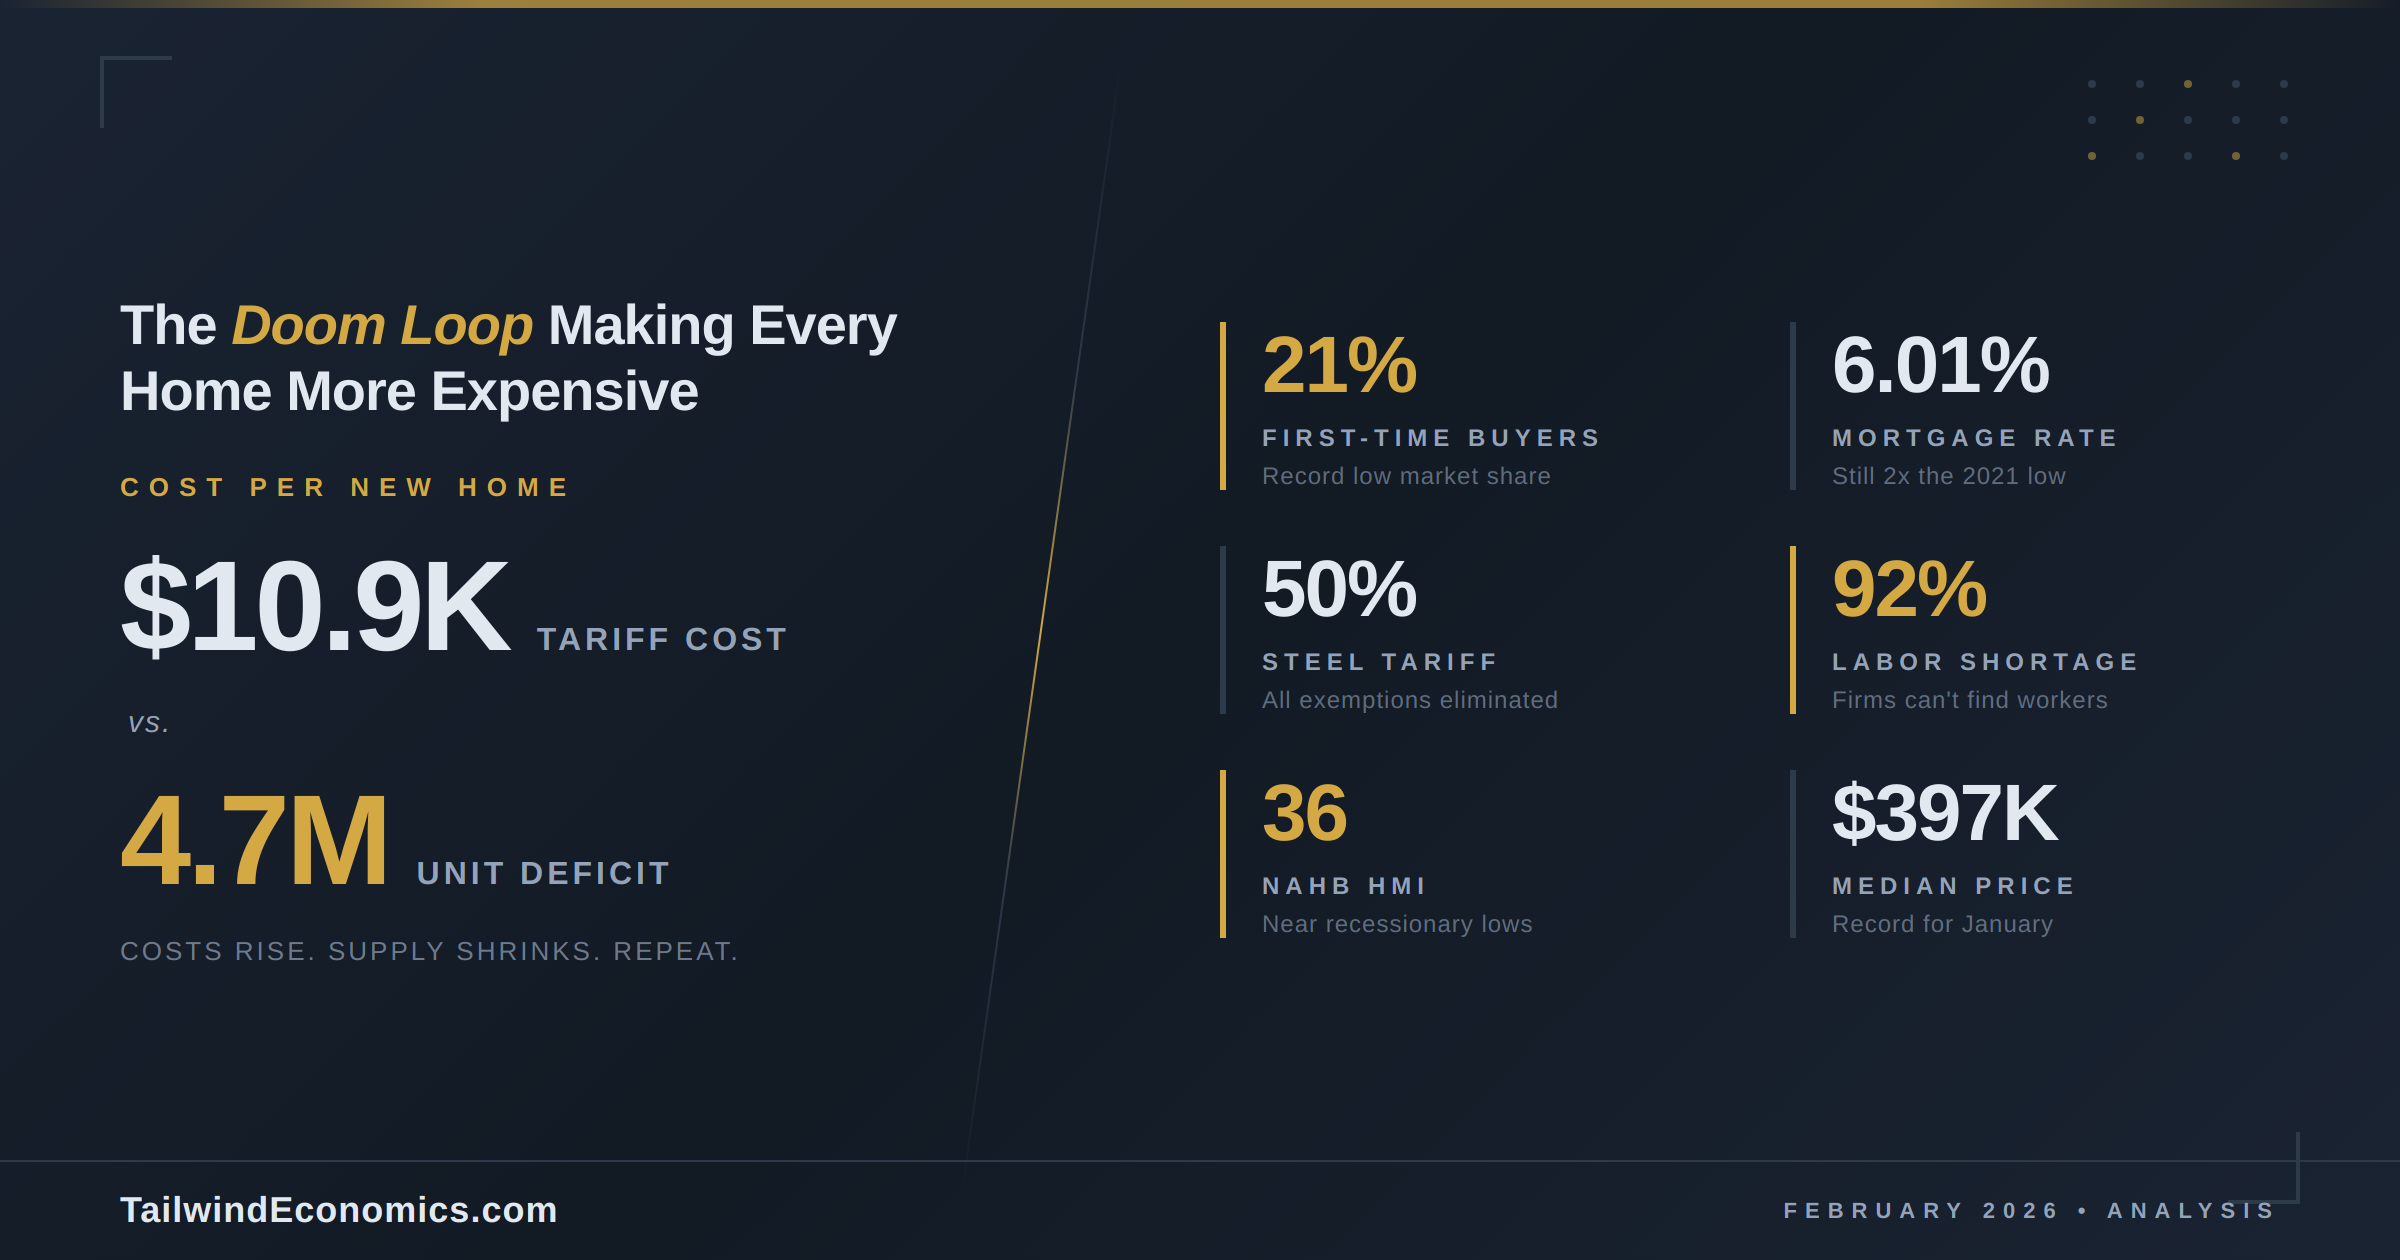
Three policy forces — tariffs that have pushed steel duties to 50%, immigration enforcement that has pulled workers off active job sites, and mortgage rates still double their 2021 lows — are feeding a self-reinforcing cycle that is simultaneously raising the cost of building homes, shrinking the workforce that builds them, and locking existing supply in place. The result: a housing deficit that Zillow estimates at 4.7 million units continues to grow even as construction activity flatlines, first-time buyers hit a record-low 21% market share, and the median age of a new homeowner climbs to 40. This is not three separate problems. It is one compounding crisis — a doom loop in which each force makes the others worse.
The backdrop is a decade of structural underbuilding that began after the 2008 financial crisis and never fully recovered. Into that gap, the current administration has layered tariffs on virtually every material that goes into a house, launched the most aggressive workplace immigration enforcement campaign in modern history, and presided over an inflationary environment that has kept the Federal Reserve cautious about cutting rates. Builders are pulling back. The NAHB Housing Market Index fell to 36 in February 2026 — near recessionary lows. Single-family housing starts dropped 7% in 2025. And the feedback loops are accelerating: tariff-driven inflation constrains rate cuts, high rates freeze existing inventory, frozen inventory keeps prices elevated, and elevated prices make the construction math even harder for builders already facing 50% steel tariffs and vanishing labor pools.
Tariffs have added a 45% tax on Canadian lumber and 50% on steel
The tariff regime affecting housing construction in 2025–2026 represents the most aggressive escalation in building material duties in modern history. Through a combination of anti-dumping and countervailing duties, Section 232 national-security tariffs, and Section 301 trade actions, the effective duty rates on key construction inputs have reached levels that fundamentally alter the economics of homebuilding.
Canadian softwood lumber — which supplies roughly 25–30% of all U.S. consumption — now faces combined duties of approximately 45%. The Commerce Department nearly tripled anti-dumping duties from 7.66% to 20.56% in July 2025, then raised countervailing duties to 14.63% in August, bringing total AD/CVD rates to roughly 35%. On top of that, the administration imposed a 10% Section 232 tariff on all imported softwood timber effective October 14, 2025. Given that the average new single-family home uses approximately 15,000 board feet of framing lumber plus 2,200 square feet of plywood and 6,800 square feet of OSB, and that wood products constitute 15–25% of total construction costs, these duties translate directly into higher home prices.
Steel and aluminum tariffs doubled to 50% in June 2025, with all prior country exemptions eliminated. In August, the administration expanded Section 232 coverage to 407 additional product categories — including fabricated steel, appliance components, air conditioning units, construction equipment parts, and kitchen cabinets. U.S. aluminum premiums hit a record 60 cents per pound; coil-based steel products surged up to 50% since January 2025. The Penn Wharton Budget Model calculated the effective tariff rate across steel and aluminum products at 39.8% as of November 2025.
Chinese building materials face the steepest penalties. The average effective tariff on Chinese goods reached 47.5% by late 2025, with specific categories far higher. Kitchen cabinets from China — layering Section 232, AD/CVD, and Section 301 duties — face effective rates exceeding 70%. Appliances containing steel became subject to the 50% Section 232 tariff on their metal content. Roofing manufacturers including Owens Corning, CertainTeed, and GAF raised prices 7–10% as of April 2025.
The NAHB's builder surveys captured the damage in real time. In March 2025, builders estimated tariff-related cost increases of $9,200 per home. By April, that figure had risen to $10,900. CoreLogic projected increases of $17,000 to $22,000 per new home over 12 months. The Center for American Progress estimated tariffs would result in 450,000 fewer homes built through 2030 — equivalent to 6% of all homes constructed in the preceding five years. Brookings calculated that tariffs added roughly $30 billion to residential investment costs, with 90% falling on new construction. As NAHB stated plainly: "For most goods, the cost is passed on to end-users, meaning consumers… tariffs on building materials raise the cost of housing."
A major legal development on February 20, 2026 — the Supreme Court's 6–3 ruling in Learning Resources, Inc. v. Trump striking down IEEPA tariff authority — invalidated the reciprocal and country-specific tariffs. However, Section 232 tariffs on steel, aluminum, lumber, and wood products remain in full force under separate legal authority. The administration immediately imposed a replacement 15% global tariff under Section 122 of the Trade Act, though that authority is capped at 150 days. The tariff landscape remains volatile.
Immigration enforcement has pulled workers directly off job sites
Construction is the single largest employer of undocumented workers in the United States, absorbing 20% of all undocumented labor. Approximately 1.5 million undocumented workers are employed in the industry, representing 13–15% of the total construction workforce. Including documented immigrants, 25–30% of all construction workers are foreign-born — a historic high of 25.5% per NAHB's Fall 2025 labor report. In specific trades, the dependency is even more striking: 61% of drywall and ceiling tile installers are foreign-born, along with 52% of roofers, 51% of painters, and 45% of carpet and tile installers.
The geographic concentration creates acute vulnerability in the markets where housing is needed most. In Miami, 51.7% of construction workers are foreign-born. In Houston, 51.4%. New York, 48.9%. San Francisco and San Jose, 47%. California's construction workforce is 41.5% foreign-born; Florida's, 38%; Texas's, 38%.
Into this labor market, 2025 brought the most aggressive workplace enforcement campaign in modern memory. Documented construction site raids escalated through the year: 33 workers detained in Ocala, Florida in May; more than 100 arrested at the FSU College Town apartment project in Tallahassee on May 29; and approximately 475 detained at a Hyundai battery plant in Ellabell, Georgia on September 4 — the largest single-site worksite raid in DHS history. Florida became the epicenter, with 295 active or pending 287(g) local-federal enforcement agreements, more than three times Texas's total.
The impact has been measurable. The 10 states with the highest concentration of undocumented construction workers saw a 0.1% drop in construction employment while other states experienced a 1.9% increase, according to Economic Insights and Research Consulting. In California, the total construction workforce dropped 3.1% between May and June 2025 following weeks of raids. The AGC's 2025 Workforce Survey, covering approximately 1,400 firms, found that 92% report difficulty finding workers, nearly one-third have been directly affected by immigration enforcement, and 45% report project delays due to shortages.
A University of Utah study analyzing the Secure Communities program (2008–2013) found that when two construction jobs are vacated by deported workers, only one is filled by a U.S.-born worker — the other goes unfilled. The research showed that deportations led to net job losses for U.S.-born workers as well, because undocumented workers complement rather than substitute for native labor. The Economic Policy Institute projected that deporting 1 million immigrants per year would eliminate 1.4 million immigrant construction jobs and cause 861,000 additional net job losses among U.S.-born workers.
The NAHB's landmark June 2025 labor study, conducted with the University of Denver, quantified the broader economic damage: the skilled labor shortage costs the industry $10.8 billion annually, results in 19,000 fewer single-family homes built per year, and adds an average of $2,639 per home in delay-related carrying costs. Average construction timelines have stretched to nearly two months longer than normal. Small builders face the worst delays — 9–12 months versus a pre-pandemic norm of 4–6 months. Construction wages jumped 9.2% in July 2025 for home building workers, with some individual trades seeing wages double since 2020. Industry guidance for 2026 projects 6–8% annual labor cost increases.
Mortgage rates have eased but the lock-in effect still freezes supply
The 30-year fixed mortgage rate stood at 6.01% as of the Freddie Mac Primary Mortgage Market Survey for the week of February 19, 2026 — the lowest reading since September 2022 and down sharply from the 7.04% peak hit in January 2025. The decline reflects cumulative Federal Reserve rate cuts totaling 175 basis points since September 2024, bringing the federal funds rate to 3.50%–3.75% as of the January 28, 2026 FOMC meeting.
But 6% is not 3%. The payment math remains punishing. On a $330,000 mortgage (roughly 80% of the median-priced home), a 6% rate produces a monthly principal-and-interest payment of approximately $1,979 — compared to $1,392 at the 3% rates common in 2021. That is $804 more per month, or nearly $290,000 in additional interest over the life of the loan. NAHB calculates that at current rates and the median new home price of $413,595, 88.2 million households — 65% of the country — are priced out.
The Federal Reserve's path forward remains constrained by the very tariffs that are raising construction costs. The January 2026 Beige Book noted that "cost pressures due to tariffs were a consistent theme across all Districts." Chair Powell acknowledged tariffs have delayed inflation's return to the 2% target. The January FOMC minutes revealed a divided committee: several participants supported further cuts, others argued for holding steady, and some "raised the possibility that rate increases could be needed." Markets expect roughly two additional cuts in 2026, with the first likely no earlier than June. Powell's term expires in May 2026, introducing additional uncertainty as the administration has pushed for more aggressive easing.
The lock-in effect — the phenomenon of homeowners refusing to sell because they would lose their ultra-low pandemic-era rates — continues to suppress inventory. According to FHFA and Redfin data from the second quarter of 2025, 52.5% of mortgaged homeowners hold rates below 4%, and 80.3% hold rates below 6%. Realtor.com found that the typical current mortgage holder pays approximately $1,300 per month, while purchasing a median-priced home today would require approximately $2,236 — a 73.2% increase. Some 82% of homeowners who wanted to sell reported feeling "locked in." The FHFA estimates the lock-in effect prevented 1.33 million home sales between mid-2022 and the end of 2023 alone.
There are early signs of thawing. Active listings reached 1.1 million nationally — the highest since 2019 — and the share of mortgages at 6% or higher (now 19.7%) has for the first time surpassed the share below 3% (20.4%). But with existing home sales at 3.91 million annualized in January 2026 — roughly 25% below the 2013–2019 average of 5.28 million — the market remains deeply constrained. NAR forecasts a 14% increase in sales volume for 2026, but even that would only return transactions to roughly 4.25 million, still well below historical norms.
A deficit of nearly 5 million homes keeps getting worse
The United States faces a housing deficit that most estimates place between 3.7 and 4.7 million units, with some reaching as high as 5.5 million. Zillow's July 2025 analysis, based on Census data, pegged the shortfall at 4.7 million — an all-time high that grew by 159,000 units in 2023 despite a construction surge, because new household formation outpaced completions. Freddie Mac estimates 3.7–3.8 million, Goldman Sachs 3–4 million, and NAR 5.5 million. The methodological differences are significant, but the directional conclusion is unanimous: the country is millions of homes short, and the gap is not closing.
Construction activity offers no relief. Full-year 2025 housing starts totaled approximately 1,358,700 units — essentially flat from 2024's 1,367,100 and far below the pace needed to close the deficit. Single-family starts fell 7% while multifamily rose 16.6%, though from a depressed base. Building permits declined for the third consecutive year, falling 3.6% to 1,425,200. Completions dropped 7.9%. The Center for American Progress projects tariffs will eliminate an additional 450,000 homes from the pipeline through 2030.
The median existing home price reached $396,800 in January 2026 — a record for the month and the 31st consecutive month of year-over-year gains. However, price appreciation has decelerated significantly: the Case-Shiller National Index showed just 1.4% annual growth in November 2025, and the FHFA House Price Index recorded 1.7% growth in October — the weakest since 2012. In real terms, adjusted for inflation, home values have effectively declined.
A pronounced geographic rotation has emerged. Midwest and Northeast metros are outperforming: Chicago posted 5.8% annual gains, New York 5.0%, Cleveland 4.1%. Meanwhile, Sun Belt markets that boomed during the pandemic are correcting. Tampa declined 4.2% year-over-year — its 12th consecutive month of annual declines. Phoenix and Dallas each fell 1.5%. Cape Coral–Fort Myers and Punta Gorda, Florida saw drops of 10–12%. The pattern reflects years of aggressive construction in the South and West that brought inventory to or above pre-pandemic levels, while the Northeast and Midwest remain tightly constrained.
New construction pricing tells its own story. The median new home price fell to $415,000 for full-year 2025, down 1.3% from 2024 — and in the second quarter, existing homes actually cost more ($429,400) than new builds ($410,800), an extremely rare inversion. Builders have resorted to unprecedented incentives: 67% used sales incentives in December 2025, the highest share in the post-pandemic era. Lennar's incentives averaged 13.3% of sales price — roughly $60,000 on a $450,000 home. Builders offered mortgage rate buydowns that brought the effective rate for new-construction buyers to 5.27%, a full percentage point below the prevailing market rate.
Affordability has reached levels not seen in a generation
The national home price-to-income ratio stands at approximately 5.0 times median household income — near the all-time record of 5.6 set in 2022 and far above the historical average of 3.2 that prevailed through the 1990s. Harvard's Joint Center for Housing Studies found that home prices rose 48% between 2019 and 2024, more than double the 22% gain in median incomes over the same period. The salary needed to afford the median-priced home has climbed to approximately $117,000 — up nearly 50% since January 2020, when $78,000 sufficed.
First-time homebuyers are being systematically excluded. Their market share collapsed to a record low of 21% in 2025, according to NAR's annual profile — down from 32% just two years earlier and half the 2007 level. The median age of a first-time buyer reached 40 years, also a record, up from 29 in the 1980s. Six-figure incomes are now required to purchase the median home in 30 states plus the District of Columbia, up from just 6 states in 2020. In San Jose, a household needs $502,000 in annual income; in San Francisco, $338,000.
Renting has become cheaper than buying in all 50 of the largest U.S. metros, per Bankrate's 2025 analysis, with the average mortgage payment running 38% above average rent. The national median asking rent of approximately $1,693 per month (for the 50 largest metros) has actually declined for 28 consecutive months year-over-year, helped by a surge in multifamily completions. But that relief is temporary: apartment construction starts fell 27% in 2024 and are projected to decline further.
The NAHB's priced-out analysis delivers the starkest conclusion: 74.9% of U.S. households — 100.6 million — cannot afford a median-priced new home. Each $1,000 increase in the median home price eliminates an additional 115,593 households from the market. Households earning $75,000 can now afford just 21% of listings nationwide, down from 49% in 2019. The homeownership rate has stabilized at 65.7%, below its 25-year average of 66.3% and well below the 2004 peak of 69.2%.
Who wins and who loses in this market
The housing doom loop creates a stark redistribution of wealth — from those trying to enter the market to those already in it, and from small operators to large ones.
Existing homeowners sit on approximately $35 trillion in aggregate equity, per NAR. Home prices have risen roughly 40% since 2020 and show no sign of meaningful national decline, given the structural supply deficit. For the 65.7% of households that own their home, the doom loop is an equity-building machine. Baby boomers dominate the market: the median buyer age is 59, and 46% of homes purchased in 2024 were by those aged 60 and over.
Cash buyers and investors have expanded their footprint. Cash purchases accounted for 29–33% of all home sales in 2025, well above the pre-pandemic norm of 28.6%. Investors purchased one-third of all single-family homes in the second quarter of 2025 — the highest share in five years. Notably, however, the largest institutional landlords (Invitation Homes, American Homes 4 Rent) are actually net sellers, having divested roughly 6,000 homes over a 21-month period. The growth is coming from small and mid-sized investors with fewer than 100 properties.
Large homebuilders are consolidating power. The top 16 public builders now control approximately 47% of new construction, up from 25% in 2013. Their scale allows them to absorb tariff costs, lock in materials through forward contracts, and offer rate buydowns that smaller competitors cannot match.
The losers are younger, poorer, and increasingly priced into permanent renting. Half of all renter households (23.2 million) are cost-burdened, spending more than 30% of income on housing. Small builders and affordable housing developers face potential "widespread bankruptcies," in the words of Noel Andrés Poyo of the Housing Partnership Network. Construction workers face a paradox: rising wages but an enforcement environment that drives workers underground or out of the industry entirely.
Geographically, the Northeast and Midwest are emerging as relative winners — Hartford, Rochester, Toledo, and Providence top Zillow's 2026 hottest markets list, driven by affordability and tight inventory. The Sun Belt is cooling fast: Florida's Cape Coral, Punta Gorda, and Tampa lead national price declines, punished by years of overbuilding now meeting insurance cost surges and waning migration.
The doom loop feeds itself — and policy could make it worse
The three forces do not merely coexist. They compound. Tariffs raise the cost of building, which reduces construction starts, which deepens the supply deficit, which keeps prices elevated. Labor shortages from immigration enforcement layer on top of material cost increases, extending timelines and adding carrying costs. High prices and tariff-driven inflation constrain the Fed from cutting rates aggressively, keeping mortgage rates elevated, which perpetuates the lock-in effect that freezes existing inventory, which further tightens supply, which supports prices — closing the loop.
The data confirms the reinforcement. Construction costs now account for a record 64.4% of the average new home price. Builder confidence sits near recessionary lows. Single-family permits have declined for three straight years. And yet median prices keep rising — because the fundamental supply-demand imbalance overwhelms every other force.
Redfin's chief economist Daryl Fairweather captured the dynamic bluntly: "Builders aren't going to want to build when they're facing tariffs on materials and labor shortages because of immigration policy." Wharton economist Ben Keys added: "If we are going to impose additional tariffs on building materials, it's going to be more expensive to build rather than less expensive to build." Moody's Mark Zandi warned that "higher tariffs, highly restrictive immigration policy, and de-globalization more broadly have upended" the inflation outlook, keeping rates higher for longer.
There are historical echoes but no perfect parallel. The post-WWII housing shortage combined acute demand, material constraints, and labor disruptions — but was resolved through massive government subsidy via the G.I. Bill. The 1970s affordability crisis paired high inflation with high rates, but lacked today's structural supply deficit. The Smoot-Hawley tariffs of 1930 offer the closest cautionary tale on trade policy: 1,028 economists petitioned President Hoover to veto the act, unemployment rose from 8% to 25%, and global trade contracted. As housing analyst M. Nolan Gray has argued, the current combination of a structural deficit, broad material tariffs, and targeted labor removal is historically unprecedented.
Policy responses are emerging but insufficient. The Housing for the 21st Century Act passed the House 390–9 in February 2026, incorporating 43 pieces of legislation aimed at zoning reform, regulatory streamlining, and expanded lending authority. The ROAD to Housing Act passed the Senate. The administration issued an executive order restricting institutional investor purchases of single-family homes, though institutional investors own less than 1% of the housing stock. Treasury Secretary Bessent has signaled that tariff reprieves for building materials are "on the table." Goldman Sachs estimates that relaxing land-use regulations alone could unlock 2.5 million additional housing units over a decade — but such reforms require action at the state and local level, where progress is slow.
Breaking the loop requires confronting its causes
The housing doom loop is not a market failure in the traditional sense. It is a policy-induced acceleration of a pre-existing crisis. The United States entered 2025 already millions of homes short after a decade of underbuilding. Tariffs that push the effective duty on Canadian lumber to 45% and steel to 50% make every new home more expensive to build. Immigration enforcement that removes workers from an industry where 92% of firms already cannot find enough labor makes every home slower to build. And interest rates that remain double their 2021 levels — held there partly by the inflationary pressure of the tariffs themselves — make every home more expensive to finance while simultaneously freezing the existing inventory that might otherwise provide relief.
The compounding math is unforgiving. NAHB estimates tariffs add $10,900 per home. Labor shortages add another $2,639 in delay costs and suppress 19,000 homes annually. High rates price out 88 million households. And the deficit grows. The only way to break the loop is to address its supply-side causes: reduce material costs by exempting construction inputs from tariffs, stabilize the construction labor force rather than depleting it, and pursue the zoning and regulatory reforms that both parties have now endorsed legislatively. Until then, the doom loop will continue doing what loops do — accelerating.
Frequently Asked Questions
Q: How much do tariffs add to the cost of a new home in 2026? A: NAHB estimates tariffs add $10,900 per new home as of April 2025, with CoreLogic projecting $17,000–$22,000 over 12 months. The primary drivers are 45% combined duties on Canadian lumber and 50% tariffs on steel and aluminum, which together raise costs on the two most material-intensive inputs in residential construction.
Q: How many homes is the U.S. short in 2026? A: Estimates range from 3.7 million (Freddie Mac) to 4.7 million (Zillow) to 5.5 million (NAR). The deficit grew by 159,000 units in 2023 alone despite a construction surge, because new household formation outpaced completions. With single-family starts down 7% in 2025, the gap continues to widen.
Q: What is the mortgage rate lock-in effect? A: The lock-in effect occurs when homeowners with ultra-low pandemic-era mortgages refuse to sell because purchasing a new home would require a much higher rate. Currently 52.5% of mortgaged homeowners hold rates below 4%. The FHFA estimates this prevented 1.33 million home sales between mid-2022 and end of 2023, suppressing inventory and keeping prices elevated.
Q: Where are home prices dropping the most in 2026? A: Sun Belt markets lead national price declines: Cape Coral–Fort Myers and Punta Gorda, Florida fell 10–12%, Tampa declined 4.2%, and Phoenix and Dallas each dropped 1.5%. These markets face a convergence of overbuilding, insurance cost surges, and waning migration. Midwest and Northeast metros like Chicago (+5.8%) and New York (+5.0%) are outperforming.
Sources: Zillow Research (July 2025), NAHB Housing Market Index (February 2026), Freddie Mac PMMS (February 2026), National Association of Realtors (January 2026), U.S. Census Bureau Housing Starts (2025), Federal Reserve FOMC Minutes (January 2026), FHFA House Price Index (October 2025), S&P CoreLogic Case-Shiller Index (November 2025), Associated General Contractors Workforce Survey (2025), NAHB Tariff Cost Analysis (April 2025), Center for American Progress (2025), Brookings Institution (2025), Penn Wharton Budget Model (November 2025), CoreLogic (2025), Redfin (2025–2026), Goldman Sachs Research (2025)