
The United States is borrowing its way into a fiscal trap that threatens both domestic prosperity and global financial stability. With gross national debt surpassing $39 trillion in early 2026 and debt held by the public reaching 100% of GDP for the first time since World War II, the country's fiscal trajectory has shifted from a distant concern to an immediate risk factor in global markets. The IMF, all three major credit rating agencies, and Federal Reserve Chair Jerome Powell have issued escalating warnings, yet Washington continues to legislate in the opposite direction.
How Decades of Bipartisan Excess Built a $39 Trillion Debt Mountain
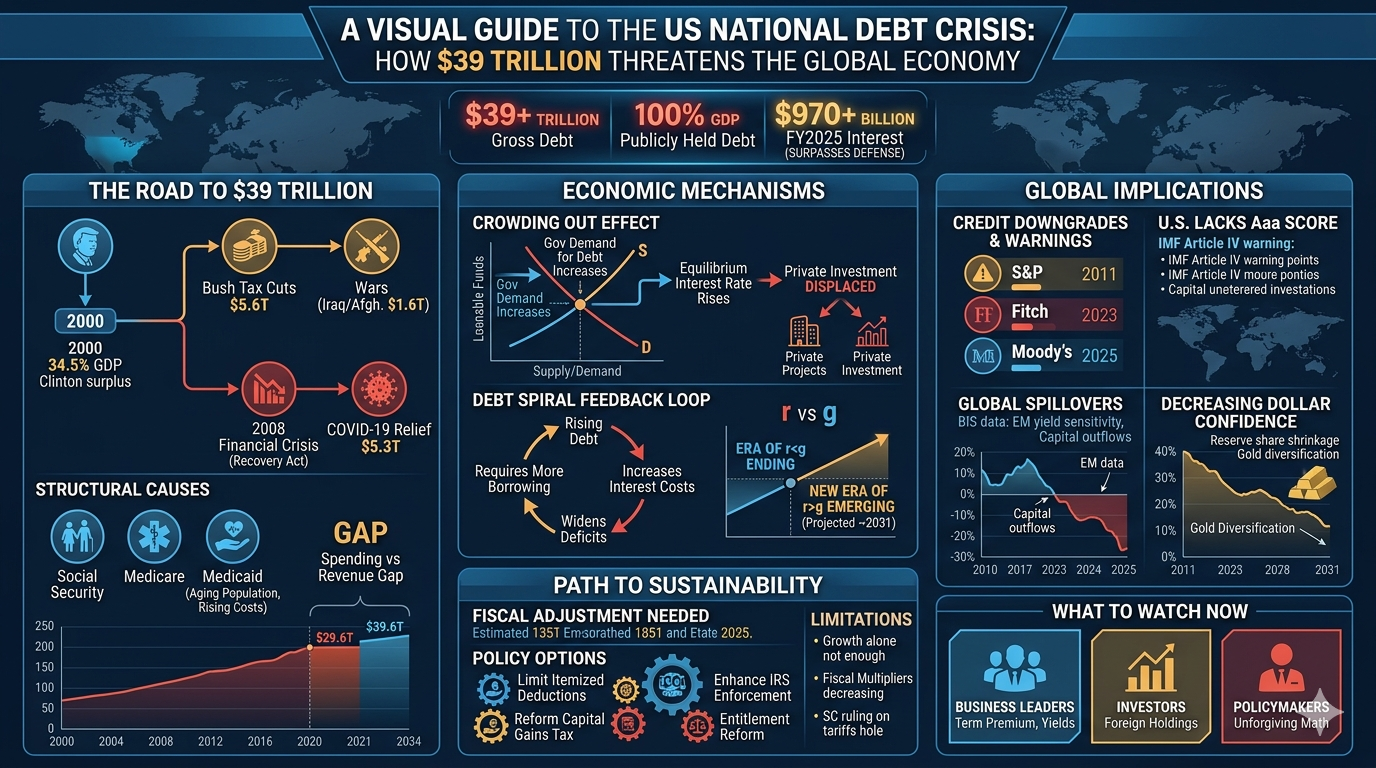
The story of America's debt is fundamentally one of compounding policy choices, each individually defensible but collectively catastrophic. Federal debt held by the public stood at just 34.5% of GDP in 2000, buoyed by Clinton-era surpluses. Then came a cascade of deficit-expanding decisions on both sides of the aisle.
The Bush tax cuts of 2001 and 2003 cost an estimated $5.6 trillion through 2018 including debt service. Post-9/11 wars in Iraq and Afghanistan added $1.6 trillion in direct appropriations. The 2008 financial crisis triggered the $836 billion American Recovery and Reinvestment Act. Then COVID-19 blew the fiscal doors open — $5.3 trillion in pandemic relief across six bipartisan bills pushed the deficit to $3.1 trillion in FY2020 and $2.8 trillion in FY2021.
The 2017 Tax Cuts and Jobs Act layered on another $1.5 trillion in conventional cost, now made largely permanent by the One Big Beautiful Bill Act signed on July 4, 2025, which CBO scores at $4.7 trillion in additional deficits over 2026–2035 on a dynamic basis. The fiscal deficit for FY2026 is projected at $1.9 trillion — roughly 6% of GDP, a level never before sustained outside wars and recessions.
Underneath these headline-grabbing legislative events, structural spending growth quietly does the heavy lifting. Social Security, Medicare, and Medicaid have grown from 4.3% of GDP in 1971 to roughly 11% today, driven by an aging population and rising healthcare costs. CBO projects these programs plus interest will consume 14.2% of GDP by 2055. Revenue, meanwhile, has averaged just 17% of GDP — creating a structural gap that no combination of tariffs, efficiency drives, or growth spurts has closed.
Why the Crowding Out Effect Is No Longer Just Theory
The economic consequences of this borrowing binge extend far beyond the government's balance sheet. The crowding out effect — a core concept in macroeconomics since Milton Friedman formalized it in the 1970s — describes how government borrowing absorbs savings that would otherwise fund private investment, pushing up interest rates and suppressing capital formation.
This is no longer an abstract textbook exercise. U.S. Treasuries now account for roughly 60% of the country's $47 trillion fixed-income market, up from less than 40% a decade ago. Apollo's chief economist Torsten Sløk has warned that this dominance is actively displacing corporate and consumer borrowing. Infrastructure Capital Advisors estimates that the crowding effect reduces U.S. GDP by approximately $300 billion annually — just over 1% of total output — based on the nearly $2 trillion deficit and the opportunity cost of foregone private investment.
The mechanism is straightforward through the lens of loanable funds theory: when the government's demand for debt increases while the supply of savings remains relatively fixed, the equilibrium interest rate rises. Fewer private investment projects clear the higher hurdle rate, and capital stock grows more slowly. Over time, this produces lower productivity growth, weaker wage gains, and reduced economic dynamism. The neoclassical growth model pioneered by Robert Solow — which holds that long-run output growth depends on capital accumulation, labor force growth, and technological progress — predicts exactly this outcome when public borrowing systematically displaces private capital formation.
Defenders of deficit spending, particularly those influenced by Modern Monetary Theory, argue that a sovereign currency issuer like the United States cannot technically default on debt denominated in its own currency, and that the real constraint is inflation rather than the debt level itself. MMT proponents contend that crowding out is overstated because the government creates new money when it spends, expanding rather than competing for the pool of financial resources. There is a grain of truth here — the U.S. does benefit from issuing debt in the world's reserve currency, and foreign capital inflows have historically moderated domestic interest rate pressures. But even sympathetic economists acknowledge that with inflation still above target and the Fed constrained by its dual mandate, the MMT framework offers limited practical guidance at current debt levels.
Interest Payments Now Exceed Defense — and the Feedback Loop Accelerates
The most visceral manifestation of the debt's weight is the interest bill. Net interest costs hit $970 billion in FY2025, surpassing defense spending ($917 billion) and approaching Medicare outlays. Through the first two months of FY2026, interest payments totaled $179 billion — up 12% year-over-year. Interest now consumes 19% of federal revenue, meaning nearly one in five tax dollars services past borrowing before funding a single school, road, or soldier.
CBO projects interest reaching $1.8 trillion by 2035 and a staggering $4.8 trillion by 2055, when it would absorb 28% of all revenue. This self-reinforcing dynamic — borrowing to pay interest on previous borrowing — represents the textbook fiscal feedback loop economists have long warned about. Once debt service costs themselves become a primary driver of new borrowing, the system enters what fiscal economists call a debt spiral: rising interest costs widen deficits, which require more borrowing, which increases future interest costs.
The Treasury market is already pricing in this risk. The term premium on long-term Treasuries has risen measurably, with the Treasury Borrowing Advisory Committee explicitly noting in April 2025 that markets are questioning whether policymakers can articulate a credible path to deficit reduction. The U.S. must refinance $4.4 trillion in maturing bonds by end-2026 at yields roughly 150 basis points above their original coupons, adding an estimated $69 billion in annual interest costs from rollover alone.
The Reinhart-Rogoff Debate and Where the U.S. Sits Today
The question of whether high debt directly causes lower growth remains one of economics' most contested empirical debates. In 2010, Harvard economists Carmen Reinhart and Kenneth Rogoff published their influential paper arguing that when public debt exceeds 90% of GDP, median growth rates fall by one percentage point and average growth drops considerably more. The finding was enormously influential — European policymakers cited it extensively to justify post-crisis austerity programs, and it shaped fiscal debates in Washington for years.
In 2013, Thomas Herndon and colleagues at the University of Massachusetts identified coding errors, selective data exclusion, and unconventional weighting in Reinhart and Rogoff's original spreadsheet. After corrections, average GDP growth for countries above the 90% threshold was 2.2%, not the -0.1% originally reported. The sharp cliff disappeared; what remained was a more modest and contested relationship. A 2022 meta-analysis was unable to reject the null hypothesis of no threshold effect after controlling for publication bias. An OECD study found that for the United States specifically, a nonlinear negative link between debt and growth may appear at ratios as low as 30% of GDP — a threshold the U.S. blew past decades ago.
The honest reading of this literature is that no magic number triggers a growth collapse, but the general pattern holds: higher debt ratios are associated with modestly lower growth, with causality likely running in both directions. What matters more than any single threshold is the trajectory — and the U.S. trajectory is unambiguously unsustainable. CBO's long-term projections show debt-to-GDP reaching 175% by 2056, a level with virtually no precedent among advanced economies outside wartime.
Fiscal Dominance: When Debt Captures Monetary Policy
Perhaps the most consequential economic framework for understanding the current moment is fiscal dominance — the regime in which a government's financing needs become so pressing that they effectively override the central bank's ability to conduct independent monetary policy. Former Treasury Secretary Janet Yellen, speaking at the American Economic Association in January 2026, warned directly that the preconditions for fiscal dominance are strengthening in the United States.
The theory is straightforward: when debt levels are modest, the central bank sets interest rates to manage inflation and employment, and the Treasury finances its borrowing at whatever rate the market demands. Under fiscal dominance, this relationship inverts. The government's need to keep borrowing costs manageable pressures the central bank — implicitly or explicitly — to hold rates lower than macroeconomic conditions warrant. The result is that inflation management becomes subordinate to debt management.
The U.S. is exhibiting early symptoms. President Trump's repeated public demands for rate cuts, his appointments of sympathetic Fed governors, and the approaching May 2026 expiration of Chair Powell's term have raised alarm among monetary economists. Western Asset Management notes that markets are already pricing fiscal dominance risk into long-term yields, with the spread between short and long-term rates reflecting uncertainty about whether future Fed chairs will prioritize price stability or government financing needs. As Yellen put it: the Fed must never become the fiscal authority's financing arm. But with the primary deficit running at 3% of GDP — requiring fiscal adjustment larger than what the IMF typically demands of distressed borrowers — the political economy of restraint is deeply challenging.
The classic historical analog is the WWII era, when the Fed capped interest rates to facilitate war borrowing — a policy that contributed to a postwar inflation spike and wasn't unwound until the 1951 Treasury-Fed Accord restored central bank independence. Like that era, the U.S. now faces high debt and political pressure to suppress borrowing costs. Unlike distressed emerging markets, however, the U.S. benefits from issuing debt in its own currency and from deep global demand for dollars — a buffer, but not an immunity.
The World Takes Notice — And Downgrades Follow
The institutional response has been unambiguous. Moody's stripped the U.S. of its last remaining Aaa rating on May 16, 2025, joining S&P (2011) and Fitch (2023) in downgrading America to the second-highest tier. For the first time in history, no major rating agency grants the U.S. its top sovereign credit score. Moody's projected federal deficits widening to nearly 9% of GDP by 2035 and warned that successive administrations have failed to reverse the trend.
The IMF's April 2026 Article IV consultation was its most pointed assessment yet, noting persistently high fiscal deficits, a continued rise in the debt-to-GDP ratio, and an increasing share of short-maturity debt that amplifies refinancing risk. IMF directors stressed the pressing need to address U.S. fiscal imbalances, warning that a decline in the net international investment position raises the risk of eventual disorderly external rebalancing — an economics term for what happens when foreign investors suddenly lose confidence. Powell, speaking at Harvard in March 2026, offered his bluntest public assessment: the current trajectory "will not end well if we don't do something fairly soon."
The global spillover channels are well-documented through what international economists call the dollar transmission mechanism. BIS research shows a 100-basis-point shift in U.S. monetary conditions moves emerging market 10-year yields by approximately 61 basis points. Higher U.S. term premiums correlate with significant EM currency depreciation and capital outflows, making debt service more expensive for developing nations that borrow in dollars. The dollar's share of global reserves has eased to roughly 57%, and while no rival currency is positioned to replace it, the gradual diversification into gold (now over 23% of official reserves) and nontraditional currencies signals eroding confidence at the margins.
The Narrowing Path to Fiscal Sustainability
The economics of debt sustainability hinge on the relationship between interest rates and growth — the r versus g dynamic that underpins the intertemporal budget constraint. For most of the past 60 years, growth exceeded interest rates, allowing debt ratios to stabilize naturally even without primary surpluses. That era is ending. Stanford's SIEPR finds that r now equals g, and CBO projects r will exceed g by approximately 2031. Once that threshold is crossed, the U.S. must run primary surpluses — currently a 3% of GDP primary deficit — merely to prevent explosive debt accumulation.
Brookings economists Auerbach and Gale estimate that stabilizing the debt ratio at current levels would require permanent fiscal adjustment of 2.33% of GDP, roughly $707 billion annually. Under current-policy assumptions that include extended tax cuts, the required adjustment rises to 3.4% of GDP. These are enormous numbers — larger than most IMF structural adjustment programs.
Ricardian equivalence, the theory advanced by Robert Barro that rational consumers offset government borrowing by increasing their own savings in anticipation of future tax increases, would suggest that deficits have no net stimulative effect because private behavior fully neutralizes public spending. In practice, the empirical evidence consistently rejects strict Ricardian equivalence: households do not save enough to offset deficits, particularly when deficits are persistent and tax increases feel politically remote. This means each dollar of deficit spending does add demand in the near term — but also adds genuine debt burden that compounds over time.
The policy toolkit is familiar but politically intractable. Revenue options — limiting itemized deductions, reforming capital gains taxation, enhancing IRS enforcement — could generate trillions over a decade. Entitlement reform through modest adjustments to Social Security's retirement age or Medicare premiums could substantially bend long-term spending curves. Yet Fiscal Lab analysis shows that growing out of the problem alone would require sustained 4.3% real GDP growth — a rate achieved in barely a third of quarters since 1947 and triple CBO's projected 1.8%.
The fiscal multiplier literature adds a final complication. At elevated debt levels, each dollar of government spending becomes less effective at stimulating growth. Mercatus Center estimates multipliers could fall to 0.15–0.20 by 2042 — meaning the U.S. is simultaneously losing fiscal space and fiscal potency. Meanwhile, the February 2026 Supreme Court ruling striking down IEEPA tariffs eliminated roughly $2.2 trillion in projected revenue, blowing another hole in the fiscal arithmetic.
What Businesses and Investors Should Watch Now
The window for gradual adjustment is narrowing. Three signals will determine whether the U.S. navigates this transition through policy or through crisis:
For business leaders: Watch the term premium and the 10-year Treasury yield. If the term premium continues rising independent of Fed rate decisions, it signals that bond investors are imposing their own fiscal discipline — and borrowing costs for everything from mortgages to equipment financing will follow. Plan capital expenditures accordingly.
For investors: Monitor foreign central bank Treasury holdings. Japan ($1.1 trillion) and China ($800 billion, down from a $1.3 trillion peak) are the key marginal buyers. A sustained drawdown by either signals a regime shift in demand for U.S. debt that no domestic policy can quickly offset.
For policymakers: The math is unforgiving. Every year of delay narrows the set of viable solutions and increases the magnitude of eventual adjustment. The question is no longer whether fiscal consolidation happens, but whether it happens by design or by market force. History suggests the latter is considerably more painful.
Frequently Asked Questions
Q: How much is U.S. national debt in 2026? A: Gross U.S. national debt surpassed $39 trillion in early 2026, with debt held by the public reaching approximately 100% of GDP — the highest ratio since World War II. CBO projects this climbing to 175% of GDP by 2056 under current policies.
Q: Why did Moody's downgrade the U.S. credit rating? A: Moody's downgraded the U.S. from Aaa to Aa1 in May 2025, citing persistent fiscal deficits projected to widen to 9% of GDP by 2035 and the failure of successive administrations to agree on deficit-reduction measures. The U.S. now lacks a top-tier rating from all three major agencies.
Q: Does high national debt cause slower economic growth? A: The evidence is nuanced. Reinhart and Rogoff's influential 2010 claim that growth collapses above 90% debt-to-GDP was substantially revised after methodology errors were identified. Corrected data shows modestly lower growth at high debt levels, but no sharp threshold — the trajectory and growth dynamics matter more than any single number.
Q: What is fiscal dominance and why does it matter for the U.S.? A: Fiscal dominance occurs when government debt becomes so large that financing needs effectively constrain the central bank's ability to fight inflation independently. Former Treasury Secretary Yellen warned in January 2026 that preconditions for fiscal dominance are strengthening in the U.S., with political pressure on Fed independence compounding the structural fiscal imbalance.