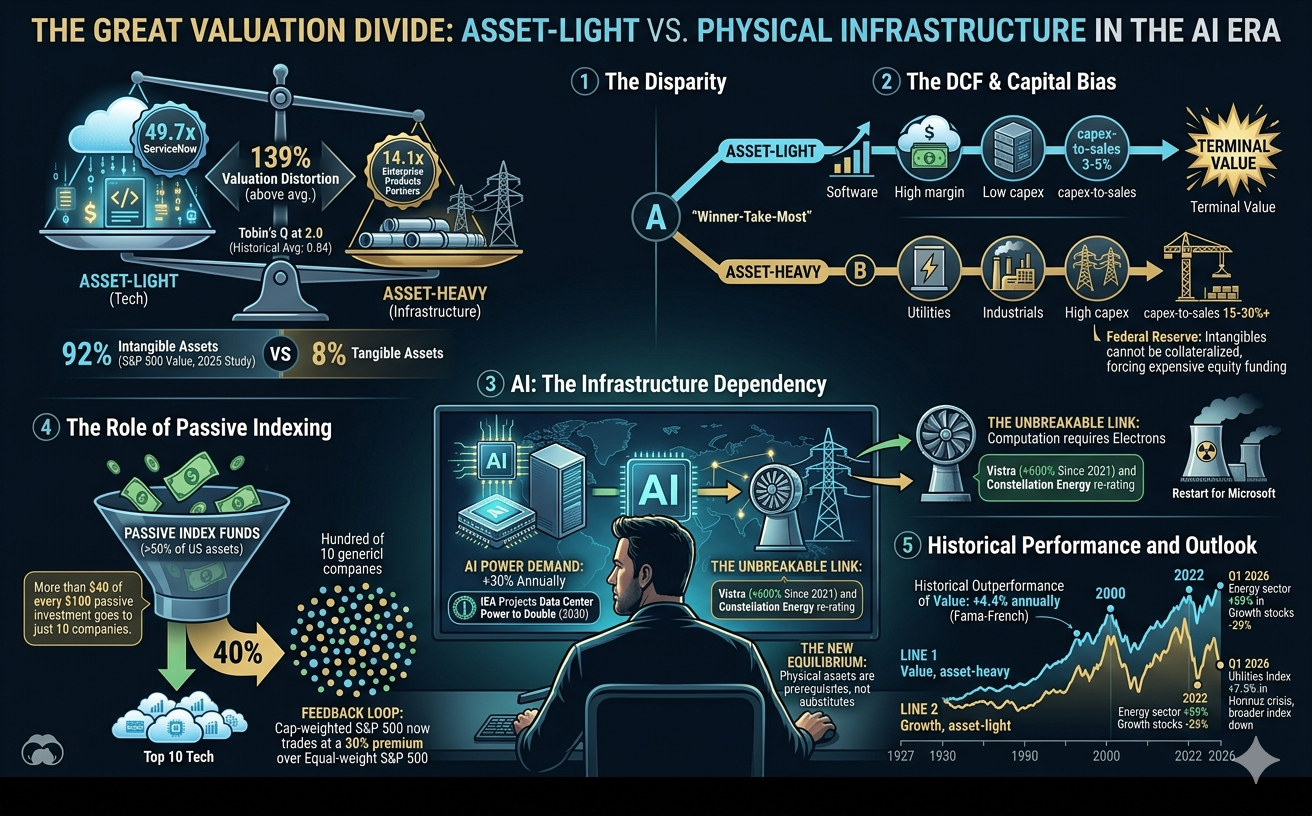
ServiceNow trades at 49.7x earnings. Enterprise Products Partners — which moves 25% of America's natural gas — trades at 14.1x. This gap is not a rounding error. It is the defining valuation distortion of modern equity markets, and it reveals a systematic bias that rewards optionality over infrastructure, scalability over substance.
The S&P 500's Information Technology sector commands roughly $19.5 trillion in market capitalization — more than 10x the entire Utilities sector at approximately $1.8 trillion. Software companies trade at average P/E ratios of ~27x and EV/EBITDA multiples of ~17x, while utilities sit at ~24x and ~15x, and pipeline operators at ~25x and ~15x. The spread is real, persistent, and — this article argues — only partially rational.
Artificial intelligence has sharpened this contradiction to its breaking point. The same market that assigns NVIDIA a $4.5 trillion valuation for the chips that power AI values the utilities that keep those chips running at a fraction of the multiple. AI is simultaneously the strongest case for the asset-light premium — and the most powerful argument that the premium is built on an incomplete accounting of what makes the economy actually function.
Tobin's Q at 2.0: The Market Has Lost Contact with Physical Reality
Tobin's Q ratio — market value divided by the replacement cost of corporate assets — sat at approximately 2.0 in early 2026, meaning investors collectively value U.S. corporations at double their tangible replacement cost. The historical average is 0.84. Today's reading is 139% above that norm, rivaling only the dot-com peak of 2.15 in early 2000.
This isn't mysterious once you understand what happened to corporate value itself. Ocean Tomo's 2025 Intangible Asset Market Value Study, covering 50 years of data, found that 92% of S&P 500 market value now resides in intangible assets — software, patents, brands, network effects, and data. In 1975, that figure was 17%. Haskel and Westlake's framework in Capitalism Without Capital explains why: intangible assets exhibit scalability (deploy globally at near-zero marginal cost), sunkenness, spillovers, and synergies — four properties that tangible assets lack. Scalability is what DCF models love most.
Why DCF Models Systematically Favor Asset-Light Businesses
A discounted cash flow model mechanically favors companies that convert revenue into free cash flow efficiently. Software companies have capex-to-sales ratios of 3–5%; utilities and industrials run 15–30%+. Gross margins of 60–80% in software dwarf the 10–20% typical of capital-intensive industries. When you project higher growth rates, higher margins, and lower reinvestment needs across a 10-year DCF, the terminal value — which represents 60–80% of total valuation — explodes upward.
This is W. Brian Arthur's increasing returns at work. Arthur demonstrated that technology markets produce winner-take-most dynamics: high upfront development costs, near-zero marginal costs, and network effects create gravitational pull toward dominant platforms. Microsoft spends once to build software that serves billions. Duke Energy must build a physical plant for every megawatt.
But the Modigliani-Miller theorem adds a wrinkle. Asset-heavy firms can collateralize their physical plants, accessing cheaper debt financing and exploiting tax shields that intangible-rich firms cannot. Federal Reserve research confirms that intangible capital generally cannot be pledged as collateral, forcing asset-light companies toward more expensive equity financing. In theory, this cost-of-capital disadvantage should partially offset their operating superiority. In practice, the market ignores it.
AI Exposes the Fatal Dependency Asset-Light Companies Have on Asset-Heavy Ones
Here is the paradox the market refuses to price correctly: the most valuable AI companies on Earth are completely dependent on the least valued ones.
The IEA projects global data center electricity consumption will double to 945 TWh by 2030, with AI-accelerated servers growing at 30% annually. In the United States alone, AI data centers are on course to consume more electricity by 2030 than the combined manufacturing of aluminum, steel, cement, and chemicals. A single hyperscale AI training cluster draws 100 MW — enough to power a small city. The five largest tech companies collectively poured over $320 billion into data center capex in a single year — twice the $160 billion the entire U.S. electric utility industry invested in generation, transmission, and distribution infrastructure combined.
You cannot train a large language model with code alone. You need turbines, transformers, transmission lines, cooling systems, natural gas pipelines, and nuclear reactors. Every token generated by ChatGPT requires electrons that flow through physical copper, over physical steel towers, from physical generating stations. AI doesn't disrupt the power grid — it consumes it. And no amount of software optimization eliminates the thermodynamic reality that computation requires energy and energy requires infrastructure.
The market is beginning to notice. Vistra — once a sleepy independent power producer — has surged over 600% since 2021 after securing AI data center power purchase agreements with Amazon and Meta. Its valuation has re-rated from a standard utility multiple to that of a growth company: 27x forward earnings with projected 68% EPS growth in 2026. Constellation Energy signed a 20-year deal with Microsoft to restart a reactor at Three Mile Island. NextEra Energy projects power demand will grow six times faster over the next 20 years than it did over the prior 20. Consensus forecasts now project 15.9% earnings growth for global infrastructure companies in 2026 — a figure more typical of a mid-cap tech firm than a regulated utility.
This is the market's own correction mechanism at work. When the asset-light thesis collides with physical constraints — grid capacity, permitting timelines, cooling infrastructure — capital rediscovers that tangible assets are not substitutes for intangible ones. They are prerequisites.
How Passive Indexing Amplifies the Tech Valuation Premium
The valuation gap is not purely fundamental. It is amplified by a structural force: market-cap-weighted passive indexing. Over 50% of U.S. equity fund assets now sit in passive vehicles. The top 10 S&P 500 stocks — overwhelmingly intangible-intensive tech companies — consume 40% of index weight but generate only 32% of index earnings.
The feedback loop is self-reinforcing. As mega-cap tech stocks rise, their index weight increases. Passive funds mechanically buy more shares. Prices rise further. The cap-weighted S&P 500 now trades at a 30% premium to its equal-weight counterpart — a gap exceeding even the dot-com era. RBC Wealth Management describes this as a "passive concentration trap": more than $40 of every $100 invested in S&P 500 index funds flows into just 10 companies. This is valuation-indifferent buying at industrial scale.
Apollo's chief economist Torsten Slok noted on April 11, 2026 that tech forward P/E ratios have compressed from 40x to 20x, returning to pre-AI-boom levels — suggesting the market may finally be questioning whether infinite scalability assumptions hold when every new AI model requires a new power plant.
Why History Favors the Companies That Build Real Things
The efficient market hypothesis would argue these premiums simply reflect superior economics. And there is evidence for that view — EY-Parthenon found asset-light companies outperformed asset-heavy peers by 4 percentage points in 5-year total shareholder returns.
But zoom out further and the picture inverts. Fama-French data since 1927 shows value stocks outperformed growth by 4.4% annually on average. Eisfeldt, Kim, and Papanikolaou's peer-reviewed research found that when intangible assets are properly included in book value, the resulting "intangible value factor" generates alpha of 3.86% per year — suggesting traditional value metrics are miscalibrated, not broken.
The market periodically remembers that physical assets matter. In 2022, energy was the only S&P 500 sector with positive returns (+59%) while growth stocks collapsed 29%. In Q1 2026, amid the Hormuz crisis, the S&P 500 Utilities Index rose 7.5% while the broader index fell 4.6%. These aren't anomalies — they're corrections that occur whenever the economy encounters a constraint that software cannot solve.
What This Means for Investors and Business Leaders Allocating Capital in 2026
The valuation gap between asset-light and asset-heavy companies is partly rational, partly structural, and partly a momentum-driven distortion amplified by passive indexing. AI has made the gap more visible — and more untenable.
For investors, the AI infrastructure buildout creates a generational opportunity in the companies that provide the physical backbone: utilities securing long-term data center PPAs, pipeline operators supplying natural gas to dispatchable generation, and electrical equipment manufacturers scaling to meet $720 billion in projected grid spending through 2030. These companies offer 5–7% dividend yields plus the earnings growth that AI demand is now delivering. Diversifying away from cap-weighted indices toward equal-weight or infrastructure-focused strategies can reduce concentration risk.
For business leaders in capital-intensive industries, the message is twofold. First, articulate the intangible value embedded within your tangible asset base — proprietary grid data, workforce capabilities, regulatory moats, and process IP. McKinsey's research shows top-quartile growers invest 2.6x more in intangibles than laggards. Second, recognize that AI doesn't threaten your business model — it validates it. You cannot automate a transmission line. You cannot digitize a transformer. You cannot deploy a large language model without the electrons your infrastructure provides.
The market's love affair with weightless companies is not irrational — but it is incomplete. And AI, ironically, is the force that will complete the picture. The most sophisticated technology ever built still needs copper, steel, and concrete to function. That reality, eventually, gets priced in.
Frequently Asked Questions
Q: Why do software companies trade at higher multiples than utilities and pipeline operators? Software companies convert a far greater share of revenue into free cash flow due to capex-to-sales ratios of 3–5% versus 15–30% for utilities. Combined with higher growth rates and network effects that create winner-take-most dynamics, DCF models mechanically produce valuations 2–3x higher for asset-light businesses. However, AI's massive power requirements are beginning to narrow this gap for electricity providers.
Q: How is AI changing the valuation of utility and energy infrastructure stocks? AI data centers require unprecedented amounts of electricity — consumption is projected to double to 945 TWh globally by 2030. This has driven re-ratings of power companies like Vistra (+600% since 2021) and Constellation Energy, which are securing long-term contracts with tech giants. Consensus forecasts now project 15.9% earnings growth for infrastructure companies in 2026, more typical of tech firms than traditional utilities.
Q: Is the valuation gap between tech and infrastructure stocks a market inefficiency? Partially. The gap reflects genuine economic differences — scalability, margins, and growth — but is amplified by passive indexing, which channels over $40 of every $100 invested into just 10 mega-cap stocks regardless of valuation. The cap-weighted S&P 500 trades at a 30% premium to its equal-weight version. Apollo data shows tech P/E ratios have compressed from 40x to 20x as of April 2026, suggesting the market is beginning to question the sustainability of the premium.
Q: Do asset-heavy stocks outperform over the long run? Historically, yes. Fama-French data shows value stocks (typically asset-heavy) outperformed growth by 4.4% annually since 1927. The pattern is cyclical, and asset-heavy sectors tend to outperform during inflationary periods, energy crises, and rising-rate environments — conditions that may persist through the AI infrastructure buildout cycle.